Time series · Model evaluation
Timestral after 561 trades: confidence meets trading costs
I gave Timestral 250 closing prices, let confidence size the next trade, and followed the money through fees, calibration, and a suspicious quote.
I wanted to know whether a time-series foundation model could do something useful with market prices: predict the next move, skip weak signals, and take larger positions when its confidence was higher. The latest experiment completed 561 simulated trades across Reliance, SPY, and EUR/USD. It did not establish a reliable trading edge.
Five accounts lost money. Three stayed in cash. EUR/USD daily gained 7.08%, but removing its largest winning trade changed that result to −4.28%. That trade also depended on a Yahoo quote that differed sharply from an independent reference. The interesting result was the distance between a plausible forecast and a defensible trading strategy.
One model, nine separate experiments
I used Mistral’s Timestral-209M checkpoint with FP32 inference and symmetric averaging. Each forecast consumed 250 closing prices and predicted the next close. The model produces 21 quantiles; the median chose long or short, while the quantile distribution supplied a raw directional probability.
Official Timestral model card · 9874d252ab0aa
Reliance represented an Indian equity, SPY a U.S. equity ETF, and EUR/USD a currency pair. Each ran on minute, hourly, and daily bars from saved Yahoo Finance snapshots. These are three instruments, not comprehensive tests of their markets. Each of the nine accounts began with 100,000 in its quote currency: INR for Reliance and USD for the other two.
The target was at least 465 executions combined. Each round advanced 128 candidate bars per active case; the run stopped after the first complete round that reached the target. After 28 rounds, 30,873 signals had produced 561 trades. The extra trades came from finishing that round, not from duplicating observations.
The accounts cover different calendar spans. Daily Reliance runs from February 1998 to March 2012, daily SPY from April 1995 to June 2009, and daily EUR/USD from January 2006 to November 2019. Intraday samples cover portions of 2024–2026. “Latest” describes the experiment, not a common recent trading window. I do not add INR and USD balances into a portfolio return.
The question hidden inside “confidence”
Earlier runs tried fixed 1× positions and then confidence gates. With the original frozen calibration of after-cost profit probability, the available eligible history produced just one execution under the 55% / 60% / 70% gates. Lower-gate replays explored trade scarcity separately. The 561-trade run changes both the calibration update rule and the event being predicted.
Here, confidence means the probability that the forecast direction is correct. It does not mean the probability of making money after fees. I kept the original leverage gates and built a custom rolling estimator around Timestral’s quantiles. This confidence rule is part of my experiment, not an official Mistral trading feature.
At each decision, I used the preceding 300 forecast origins whose outcomes had already exited strictly before the new entry. Raw directional probabilities went into ten fixed bins. If the matching bin had N observations and W correct directions, the smoothed estimate was (W + 1) / (N + 2). A bin needed 20 observations; otherwise it fell back to the valid past window. Insufficient total support gave 50%, which skipped the trade.
Below 55%, stay in cash. From 55% to below 60%, use 1×. From 60% to below 70%, use 2×. At 70% or above, use 3×. An unchanged forecast median skips; an unchanged realized price counts as a directional miss. The completed run used 537 trades at 1×, 24 at 2×, and none at 3×.
What happened to the accounts
| Instrument | Bars | Trades | Ending balance | Net return | Max drawdown |
|---|---|---|---|---|---|
| Reliance | Minute | 8 | 98,484.70 INR | -1.52% | -1.52% |
| Reliance | Hourly | 0 | 100,000.00 INR | +0.00% | 0.00% |
| Reliance | Daily | 9 | 78,149.73 INR | -21.85% | -21.85% |
| SPY | Minute | 256 | 77,858.92 USD | -22.14% | -22.14% |
| SPY | Hourly | 107 | 88,477.65 USD | -11.52% | -11.77% |
| SPY | Daily | 11 | 97,820.08 USD | -2.18% | -2.97% |
| EUR/USD | Minute | 0 | 100,000.00 USD | +0.00% | 0.00% |
| EUR/USD | Hourly | 0 | 100,000.00 USD | +0.00% | 0.00% |
| EUR/USD | Daily | 170 | 107,077.69 USD | +7.08% | -7.72% |
Account summary (CSV) · View account equity curves
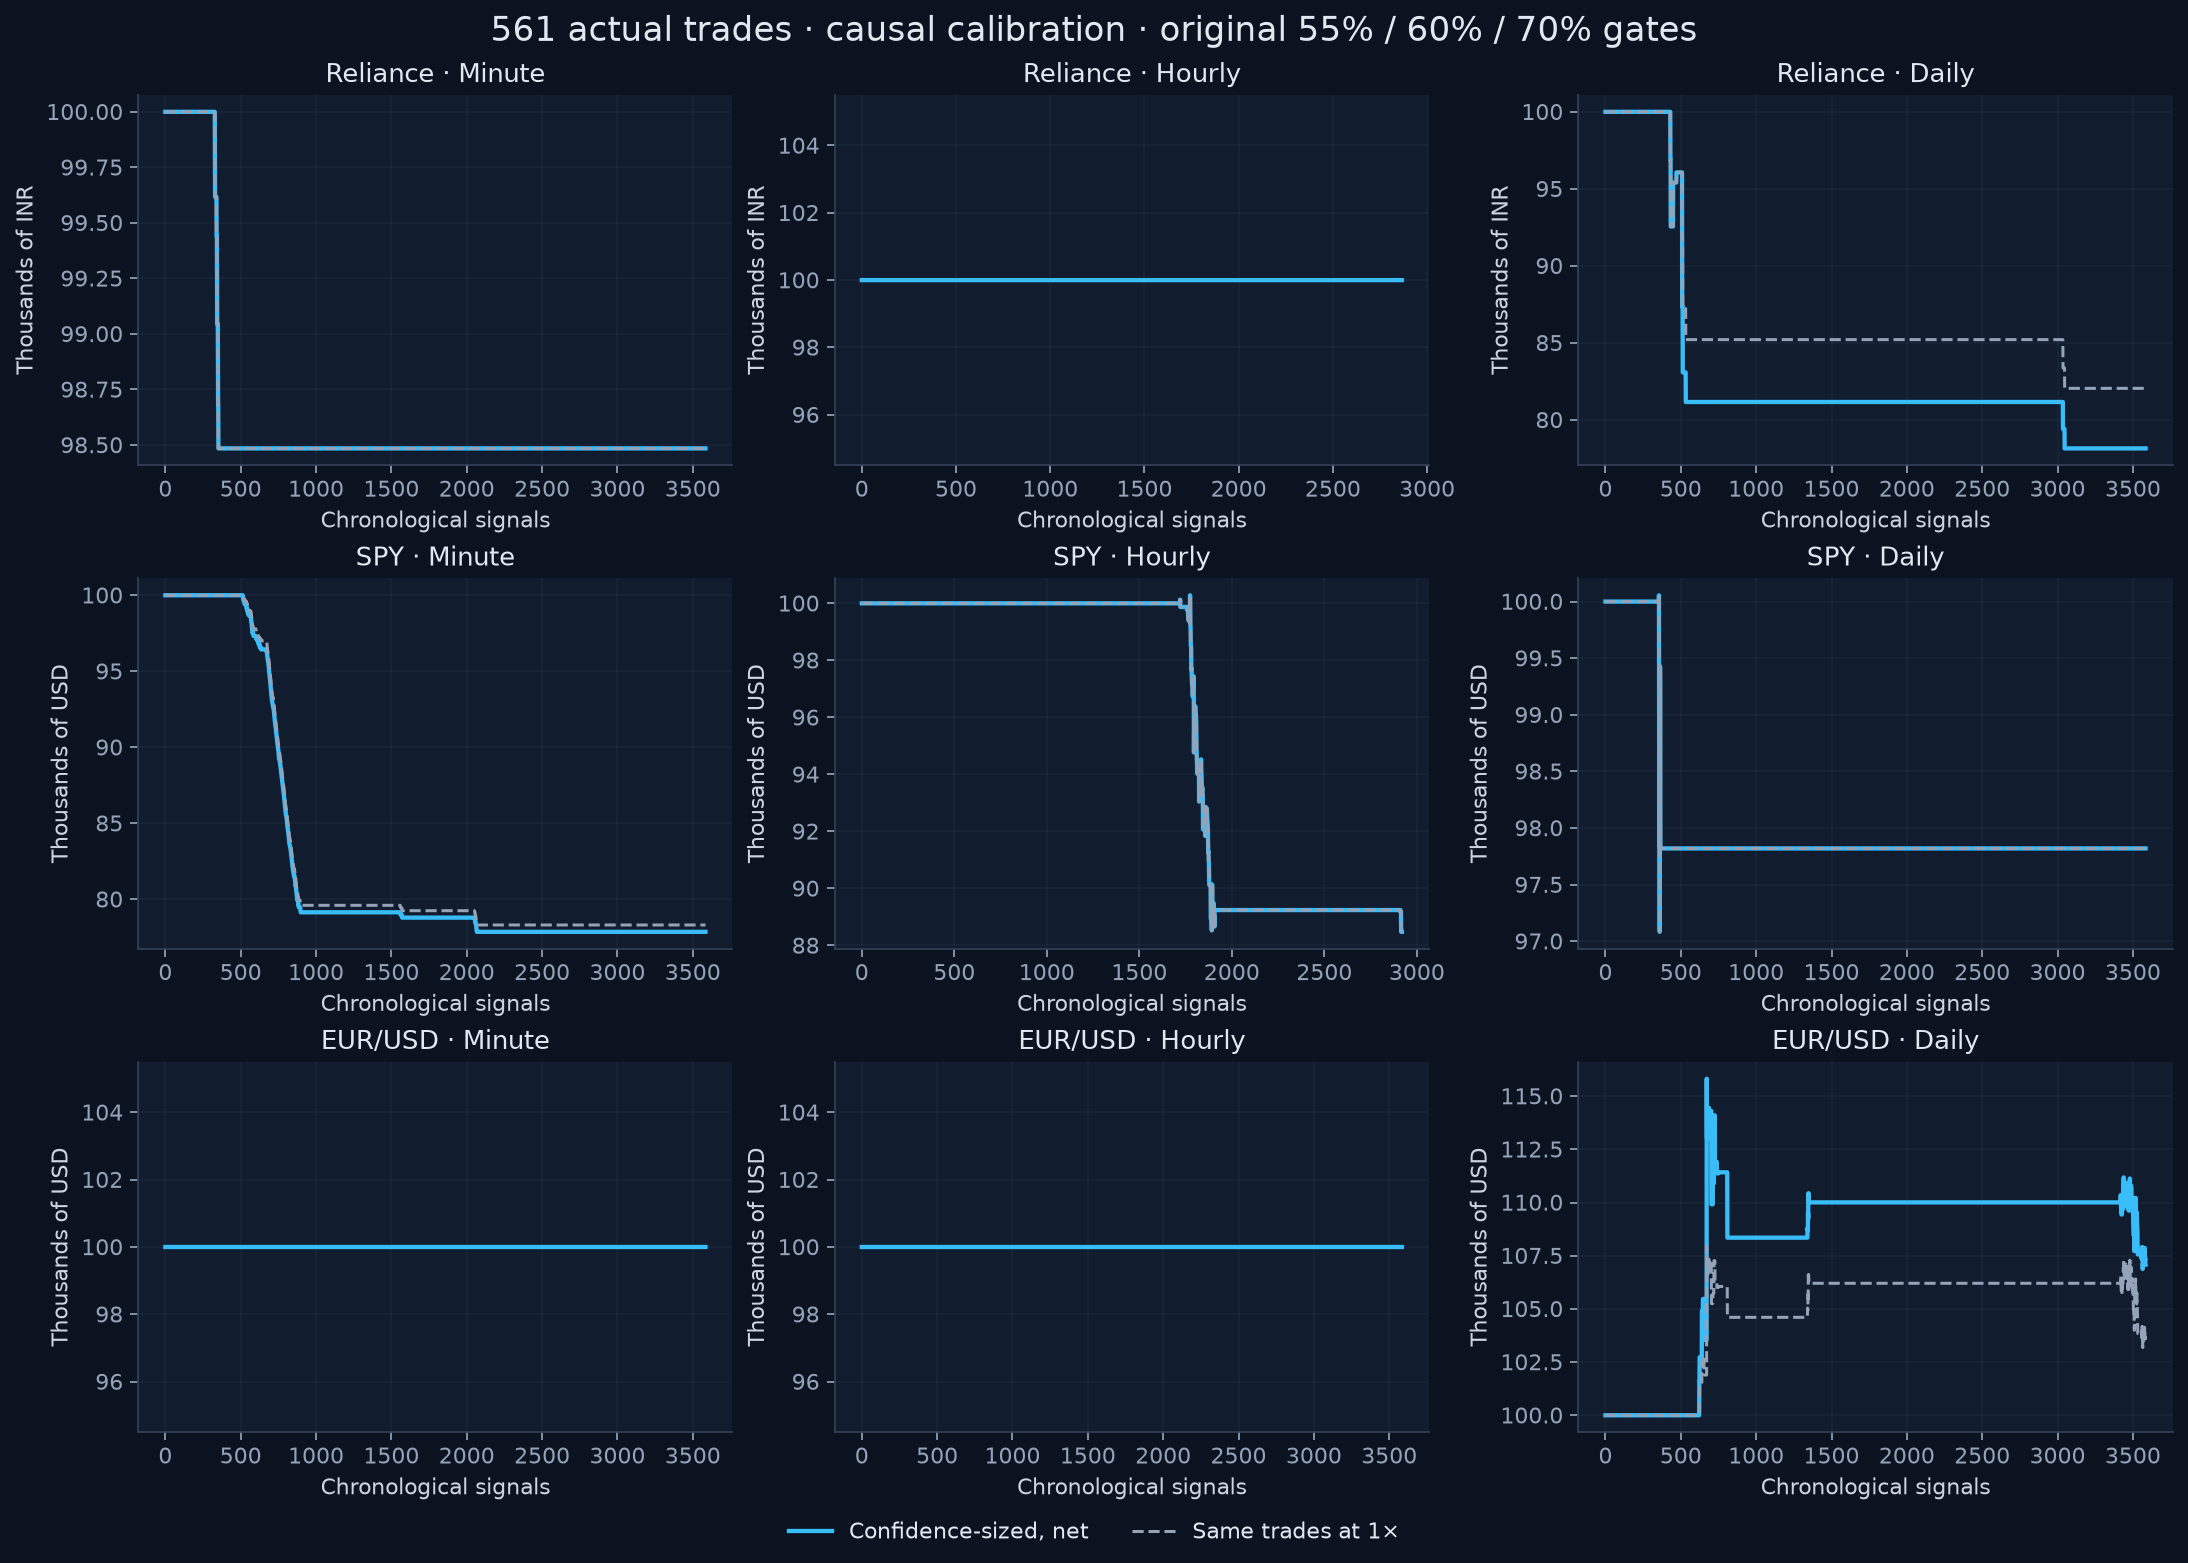
Correct direction can still lose money
Every selected signal opened at the current close and closed at the next observed close. Even consecutive signals in the same direction reopened and paid again. The simulation charged 10 basis points per fill for Reliance, 5 for SPY, and 2 for FX, plus 8% annual financing on exposure above 1× and 3% annual short borrow. Entry fees reduced investable exposure.
SPY minute makes the problem concrete. Its 256 selected trades got the direction right 51.17% of the time, but only 1.17% made money after costs. The same selected trades returned +1.08% without costs and −22.14% with them. Fees alone totaled $23,106.35. Repeatedly paying to capture tiny moves overwhelmed the forecast.
Forecast quality deserves its own scorecard
I measured errors on next-bar fractional returns against a no-change forecast, rather than relying on price-level R². Median return MAE was worse than no-change in eight of nine cases; daily EUR/USD improved by only 0.58%. Meanwhile, mean quantile loss improved by 21.75–30.92%, and the nominal 80% intervals covered about 79.21–82.59% of outcomes.
Those distributional results use a weak probabilistic baseline: every baseline quantile equals the current close. Better quantile loss and reasonable marginal interval coverage do not establish a profitable direction signal. Brier scores also stayed near 0.25 in most cases, the score of a constant 50% forecast. The lower EUR/USD minute score needs context: 54.66% of realized prices were unchanged, and unchanged prices count as misses.
The winning account needed the hardest inspection
EUR/USD daily ended at $107,077.69 after 170 trades. Its largest winner, from September 8 to September 9, 2008, returned 11.86% on that trade. Omitting it from compounding leaves the account at −4.28%. This is a sensitivity check, not a repaired backtest.
For the September 8 entry, Yahoo supplied approximately 1.5050 USD per EUR; the saved ECB reference was 1.4214, a difference of about 5.9%. Reference fixings and daily closes occur at different times, so they need not match exactly. This discrepancy is still large enough to make the apparent edge unconvincing.
The audit flagged 12 extreme daily intervals, one directly traded. I kept the original inputs and reported the problem. Removing one trade cannot repair contaminated price histories: suspect bars also enter later 250-price contexts and 300-origin calibration windows. Validating the quotes and rerunning those dependent forecasts is still necessary.
What I would require before trusting the strategy
The saved audit passed trade uniqueness, account arithmetic, chronology, source-hash checks, and 45 independently rebuilt calibration windows. It explicitly did not verify source-quote quality. Passing those checks means the simulation follows its rules; it does not validate the economic assumptions.
I redesigned the method after seeing earlier results, so this is retrospective strategy research. Possible overlap with model pretraining, adjusted historical prices, and ideal same-close fills all limit the conclusion. The simulation omits inference latency, taxes, cash interest, FX carry, and intrabar margin liquidation. A next observed bar can also span a weekend or market closure.
My next experiment would validate the price feed first, freeze the strategy before seeing a fresh holdout period, and use executable fills with realistic costs. I would compare both forecasting and account returns against simple baselines. The lesson from these 561 trades is that confidence must name an event, costs must be paid explicitly, and the most attractive result must survive scrutiny of its inputs.
Inspect the evidence
The saved artifacts below preserve the completed run. The archive retains its original “465” filename because that was the target; its ledger contains all 561 executed trades. It includes input data, scripts, and the report. Source hashes identify the copies published with this post.